Enhanced Wildfire Tracking with Europe's Copernicus Satellite Service
Europe's Copernicus program has upgraded its satellite service to improve wildfire tracking amidst increasing global wildfire threats. This feature offers detailed visualizations crucial for monitoring and responding to wildfires effectively.
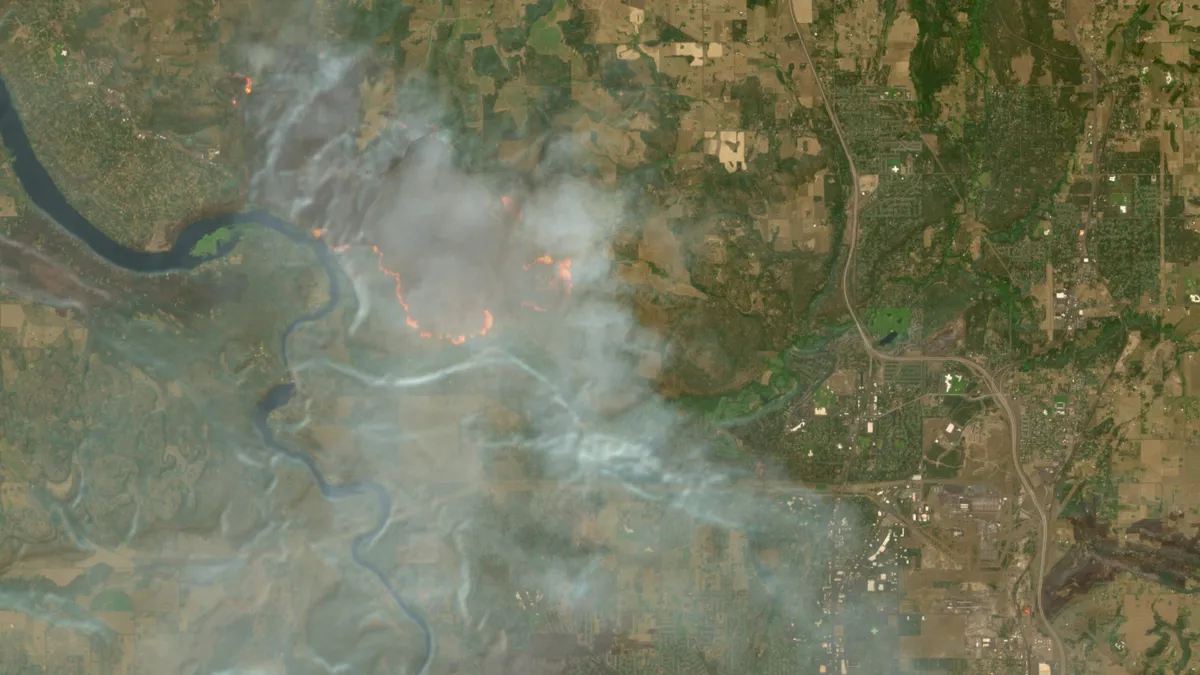
As wildfires increasingly ravage landscapes and communities around the globe, the need for effective monitoring and response strategies has never been more critical. Recognizing this urgency, Europe’s Copernicus program has taken a significant step forward by enhancing its free satellite imagery service, enabling more precise tracking of wildfires. Launched on August 4, 2023, the new wildfire visualization layer within the Copernicus Browser makes it easier for users to identify active fires, assess damage, and support firefighting efforts.
The Copernicus Earth observation program, initiated by the European Union (EU), harnesses the power of satellite technology to monitor environmental changes. The program's Sentinel-2 satellites, in particular, are equipped with advanced multi-spectral imaging capabilities that allow for detailed analysis of land use and vegetation health. With the recent integration of a wildfire visualization script, users can now visualize wildfires in real-time, marking a pivotal advancement in the fight against escalating wildfire threats.
Understanding the Copernicus Program and Sentinel Satellites
Launched in 2014, the European Space Agency's Copernicus program is dedicated to providing comprehensive data about the planet's environment. The program comprises various satellite missions, with Sentinel-2 being a crucial component focused on monitoring land and vegetation. Each of the three Sentinel-2 satellites captures images with an impressive spatial resolution of up to 10 meters, enabling users to differentiate between healthy and burned vegetation.
How the Wildfire Visualization Layer Works
The new wildfire visualization feature is based on a JavaScript script developed by remote sensing expert Pierre Markuse. This script cleverly combines data from different spectral bands to highlight various aspects of wildfires:
- Active Fires: Displayed in white or yellow.
- Burning Vegetation: Represented in red.
- Burned Landscapes: Shown in dark brown or black.
Previously, users could manually input this script into the Copernicus Browser, but now, thanks to the advocacy of Simon Proud, a mission scientist for Sentinel-2, this tool has been integrated as a default option. This integration simplifies access for users, making it easier for them to track wildfires without requiring technical expertise.
The Global Wildfire Crisis
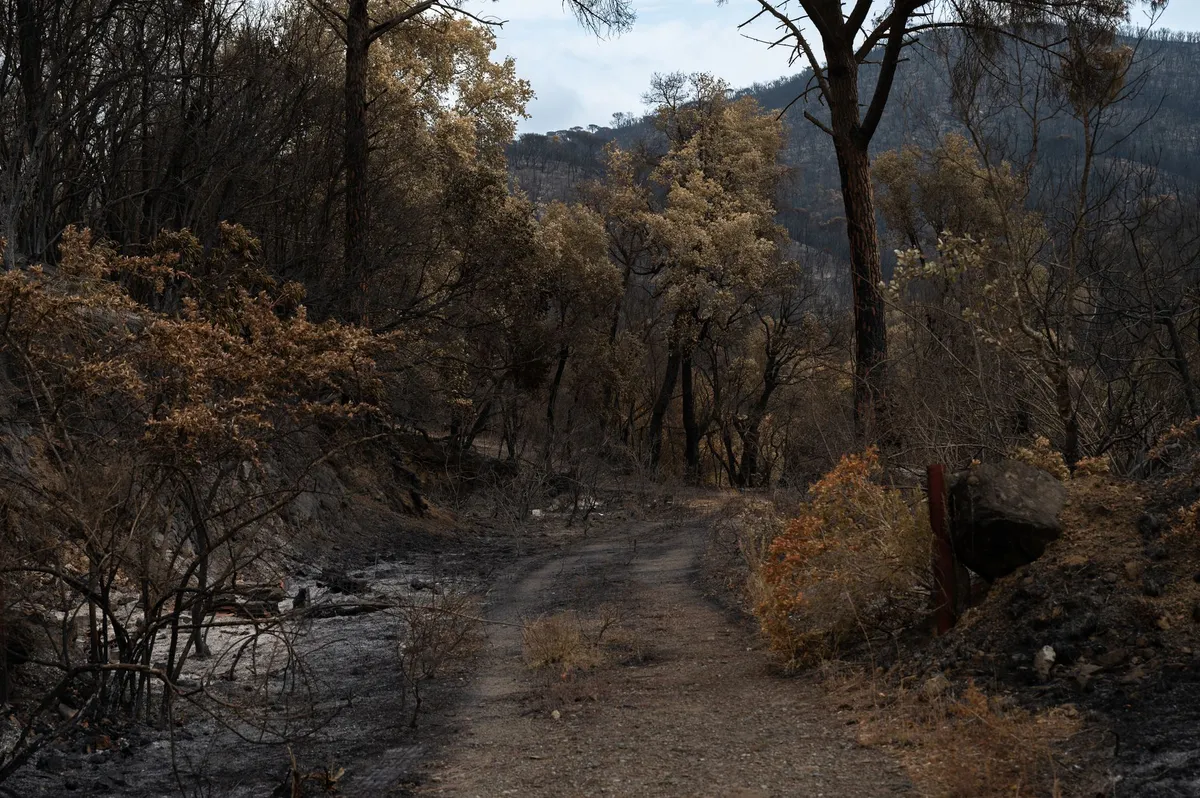
Wildfires have become a pressing global concern, exacerbated by climate change and shifting weather patterns. Regions such as Washington and Oregon in the United States, parts of Canada, and southern Europe have experienced unprecedented wildfire seasons. Reports indicate that Canada is on track for one of its worst wildfire seasons ever, while countries like France and Spain have witnessed mass evacuations due to raging fires. With the frequency and intensity of wildfires increasing, tools that enhance tracking and response capabilities are invaluable.
Comparative Tools for Monitoring Wildfires
While Copernicus provides high-resolution imagery, it is not the only player in the field of wildfire monitoring. NASA’s Fire Information for Resource Management System (FIRMS) also offers access to satellite-detected fire data. However, the notable difference lies in resolution: FIRMS typically provides data at a coarser resolution of 250 meters, while Sentinel-2 delivers imagery at 10 meters. This higher resolution allows for a more detailed understanding of wildfire impacts and dynamics.
Implications for Communities and Firefighters
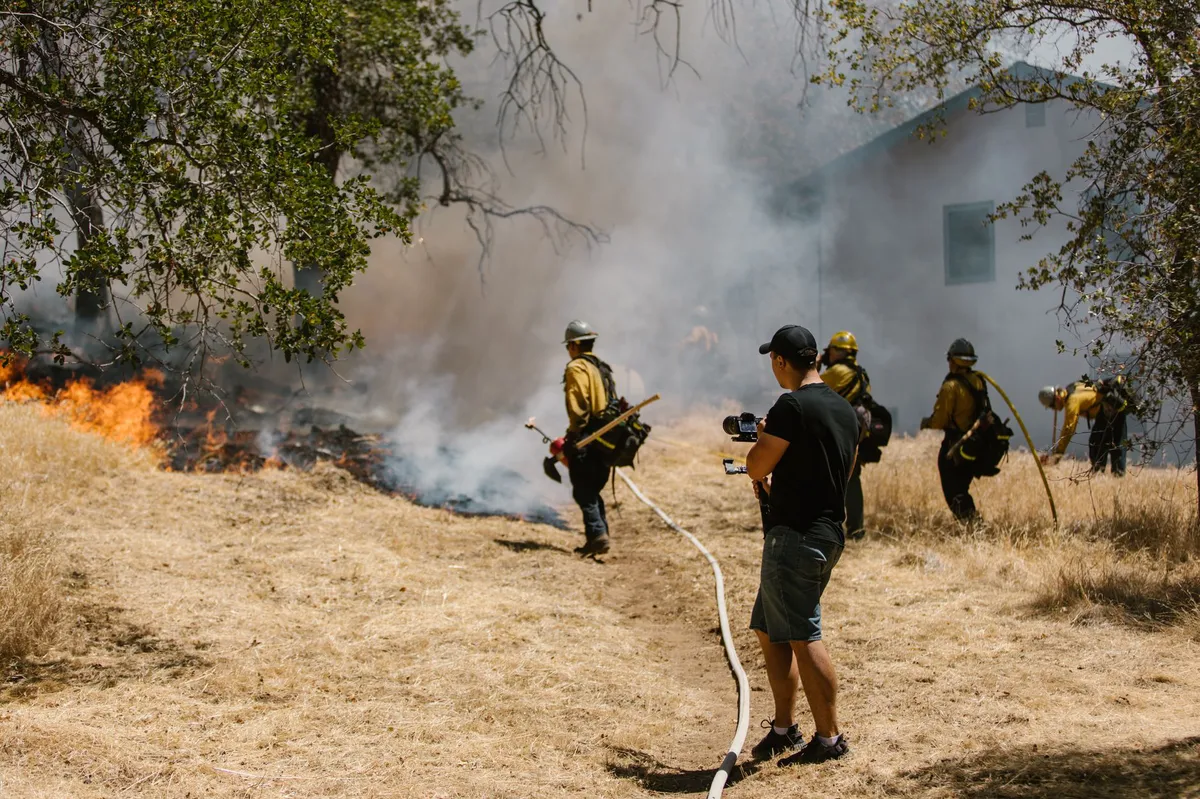
The enhancement of the Copernicus Browser's wildfire visualization layer has significant implications for various stakeholders, including emergency responders, policymakers, and communities affected by wildfires. Access to real-time data allows firefighters to make informed decisions, prioritize resource allocation, and develop effective strategies for containment and mitigation.
Empowering Local Communities
Communities at risk from wildfires can also benefit from this technology. By utilizing the Copernicus Browser, residents can monitor conditions in their areas and receive timely updates on wildfire activity. This accessibility fosters a greater sense of preparedness and can empower individuals to take proactive measures to protect their homes and families.
Future of Satellite Technology in Disaster Response
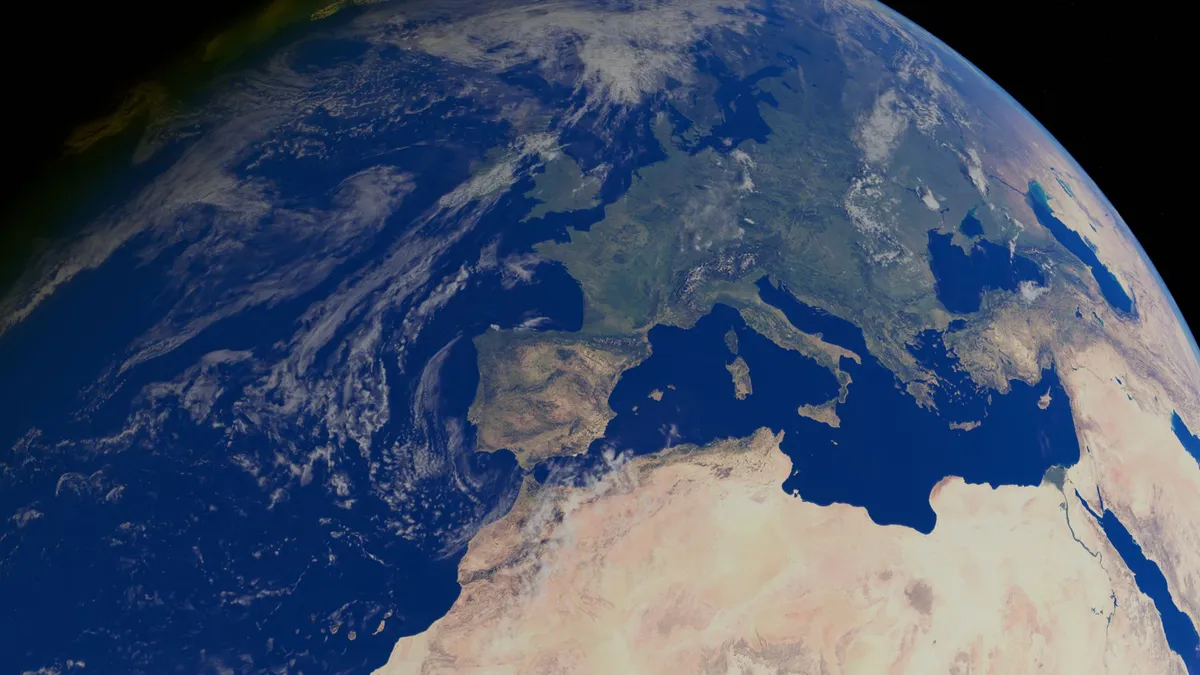
The integration of advanced visualization tools into satellite services marks a crucial step towards improving disaster response strategies. As climate change continues to influence weather patterns and increase the frequency of natural disasters, the role of satellite technology in monitoring and managing these events will only grow in importance.
Innovations on the Horizon
Looking ahead, it is likely that further innovations will emerge in the realm of satellite technology. Enhanced imaging capabilities, real-time data analytics, and improved accessibility will all contribute to more effective monitoring and response efforts. The Copernicus program, with its commitment to open data and public accessibility, is well-positioned to lead the way in these developments.
Key Takeaways
- Copernicus Browser: Enhanced with a wildfire visualization layer for real-time tracking.
- Sentinel-2 Satellites: Provide high-resolution imagery, crucial for wildfire analysis.
- Global Wildfire Crisis: Escalating wildfire seasons necessitate advanced monitoring tools.
- Community Empowerment: Local residents can utilize satellite data to enhance preparedness.
- Future Innovations: Ongoing advancements in satellite technology promise improved disaster response.
Frequently Asked Questions
What is the Copernicus program?
The Copernicus program is a European Union initiative that provides comprehensive Earth observation data through a series of satellites. It aims to monitor environmental changes and support various applications, including disaster response, climate change adaptation, and resource management.
How does the wildfire visualization layer work?
The wildfire visualization layer uses a combination of spectral bands from the Sentinel-2 satellites to display active fires, burning vegetation, and burned landscapes in distinct colors. This visual representation allows users to easily interpret and analyze wildfire conditions in real-time.
What are the advantages of Sentinel-2 imagery over other satellite services?
Sentinel-2 imagery offers significantly higher resolution than many other satellite services, such as NASA’s FIRMS. With a spatial resolution of 10 meters, Sentinel-2 enables detailed analysis of land use and vegetation health, making it a more effective tool for monitoring wildfires and assessing their impacts.
How can communities access this satellite data?
The Copernicus Browser is a free and open-access platform that allows users to view and analyze satellite imagery, including the newly integrated wildfire visualization layer. Communities can utilize this tool to monitor wildfires and stay informed about conditions in their areas.
Comments
SpaceX's Terafab: A Natural Gas Future Amid Solar Ambitions
SpaceX's decision to power its upcoming Terafab semiconductor factory with natural gas raises questions about sustainability and energy strategy. As the tech giant invests billions in new facilities, the implications for the energy sector and the environment are significant.
Related articles
Popular in Cloud Computing
- SK Hynix's Historic $26.5 Billion IPO: A New Era for Memory Chips
- Kubernetes and the Future of Desktop Infrastructure: A Paradigm Shift
- Amazon Expands Partnership with Nvidia, Tripling GPU Orders Amid AI Demand Surge
- Elon Musk's Evolving Relationship with Anthropic: A New Era for AI Hosting
- Emerging Rocket Launches: A New Era for Space Exploration